STEP 2: False Positive Assessment
Procedures
As a rule of thumb, if it takes you more than about ~5 minutes to run through these steps to determine if the alert is a true positive or not - it should be recorded as a case/ticket for deeper investigation.
After selecting an alert, you must perform an initial triage of the alert in order to determine if it is a false positive that needs to be closed/tuned out, or an alert worth deep diving into:
TIP: Review the Investigation Tips below for ideas on different techniques that can be used to investigate the alert
Step 2.1. Determine if the alert is due to CPT activity
A large number of alerts are normally due to CPT activity and never get tuned, causing CPT's to spend A LOT of time chasing their own tails.
- Does the alert involve a user account (
user.name) assigned to the CPT?
Example: CPT host analysts performing on-net actions may trigger alerts
Exception: The CPT account could be potentially compromised
- Does the alert involve IPs (
source.ip/destination.ip) assigned to/in use by the CPT?
Example: Nearly all CPT on-net actions will be sourced from the DIP's external IP and is guaranteed to trigger alerts
Exception: The weapon system could be potentially compromised - for example, an operator accidentally detonates malware on their MIP
- Does the alert involve services, processes (
process.name/process.command_line), files (file.name/file.path), or any other activities attributable to CPT activities or tools?
Example: Metasponse and Endgame are particularly noisy and generate alot of alerts
Exception: Advanced malcious actors tend to mimic existing security tools in order to evade an analyst's detection
Step 2.2. Determine if the alert is due to native system activity
The amount of time spent on this step varies between analysts due to differing levels of Operating System knowledge - in any case, research is required to validate these behaviors.
- Is the alert just pointing out activity that normally occurs in the environment, such as routine OS activity?
Example: Process injection often occurs on Windows hosts as part of normal system activity
Example: Stopping the event logging service is a form of defense evasion - but also occurs as part of a normal system shutdown
Example: VMware processes often perform process-injection and process memory access within a VM
Example: Tanium Discover and McAfee Rogue System Detection routinely leverage hosts to perform network scans of the local subnet
Step 2.3. Determine if the alert is benign to the environment
There may be Mission Partner specific hosts, software, and/or user behaviors that are normal within their environment, but highly anomalous in others - you will need to directly ask the Mission Partner or refer to documentation in order to verify whether the activity is benign or not.
- Does the alert involve routine administrative actions by know admin accounts?
Example: An admin creating user accounts as part of their normal duties
- Does the alert involve IPs attributable to known vulnerability scanner systems?
Example: ACAS scanner vulnerability probes look very much like exploitation attempts
- Does the alert involve services, processes, files, or any other activities attributable to security tools?
Example: Some Tanium modules are packed with open-source tools such as nmap but are vital to some of the security tool's functions
Investigation Tips
Event Analyzer
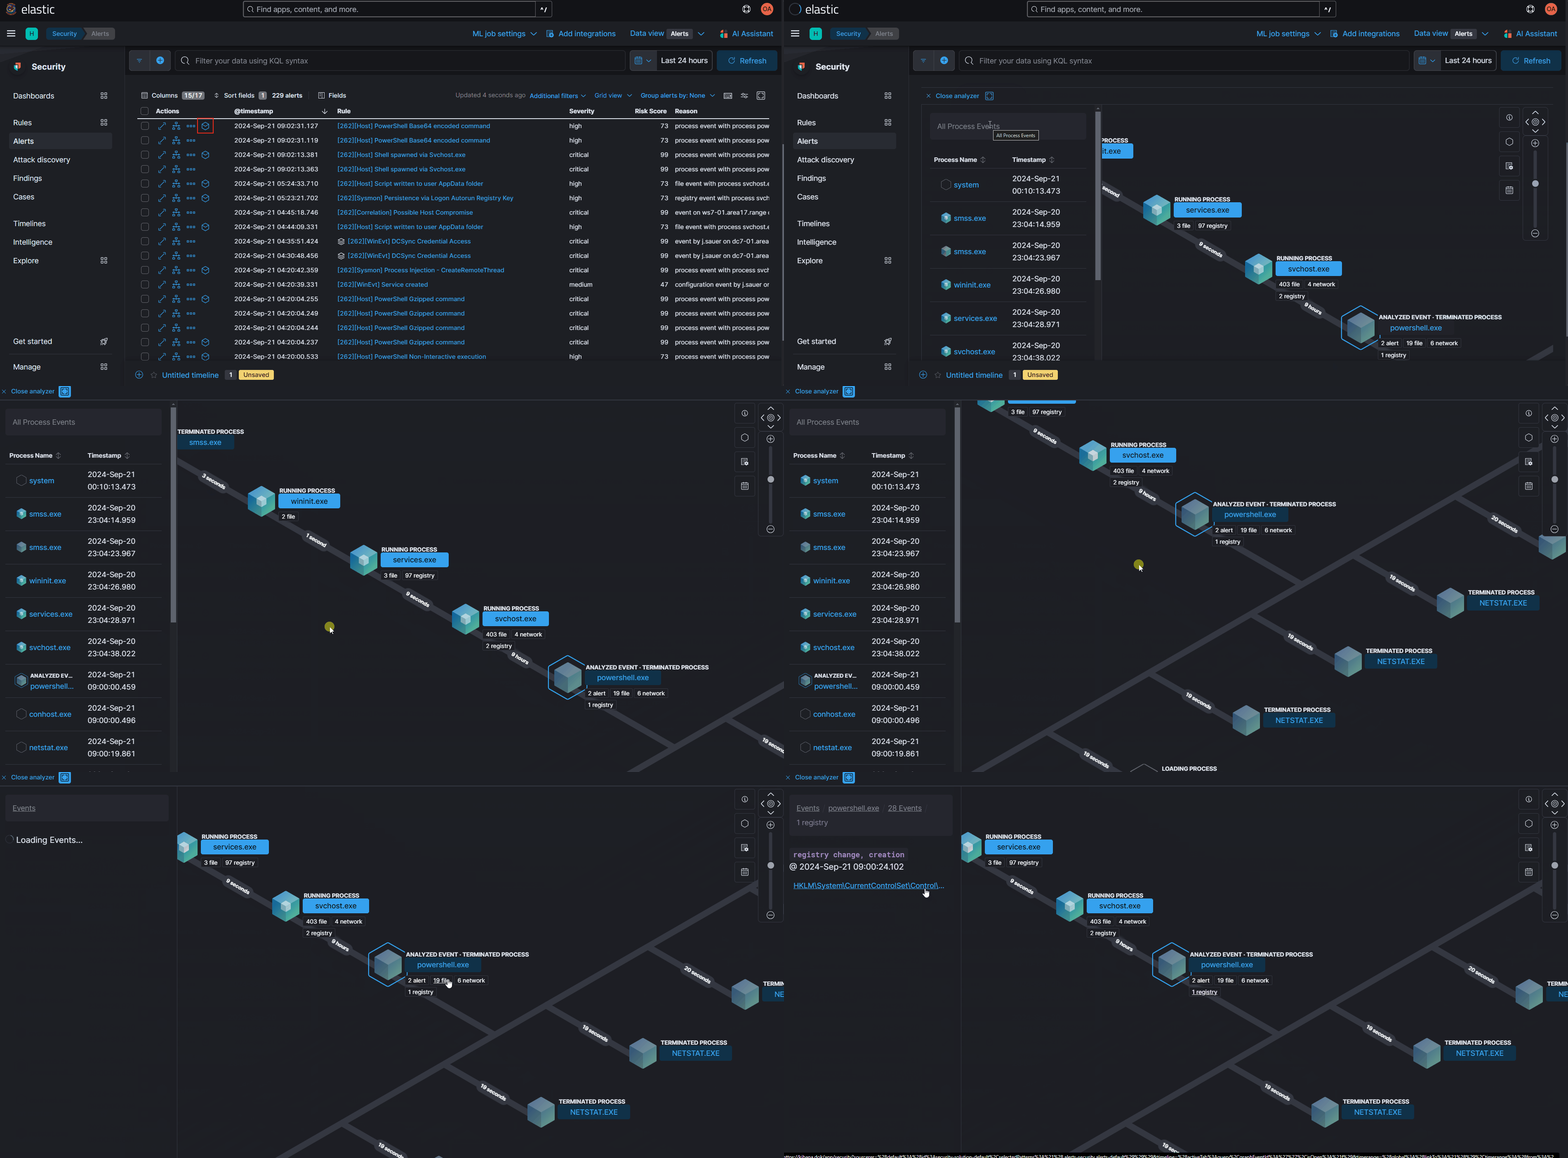
What it is: Alerts sourced from a Sysmon/Auditbeat process related log (has a process.entity_id field), the ⬡ (Analyze event) button will be available where you can interactively investigate parent/child relationships as well as any other process related events in a visual manner – similar to Endgame's visualizer.
How to get there:
- Select the alert you want to work with
- Click the
⬡(Analyze event) button to expand the alert's event analyzer
Alert Overview
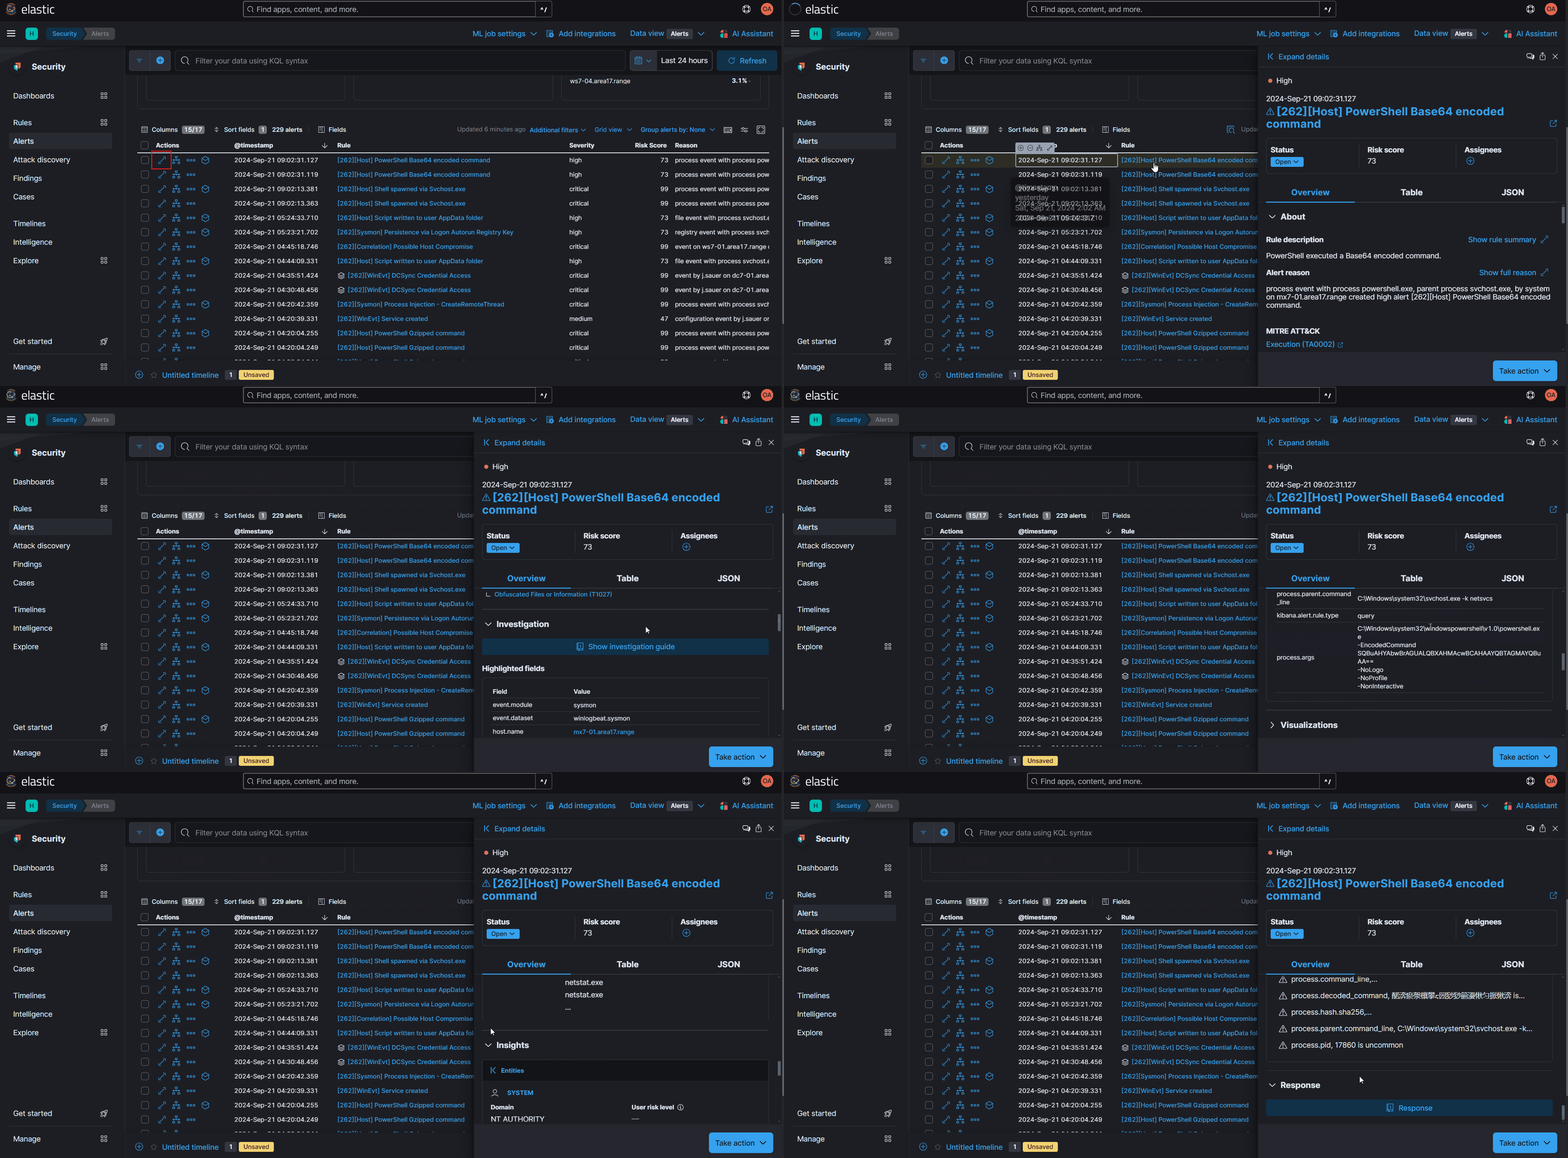
What it is: The alert overview provides additional details about the alert (you can view all fields via the adjacent Table tab). There are many sections within the alert Overview, but the most notable are:
- About
- Rule Description: The description of the alerting rule as written by the rule author.
- Alert Reason: A summary of the alert automatically generated by Kibana.
- Highlighted Fields: All fields that Kibana (and the rule author) believe are most relavent to the analyst when investigating the alert. Remember that you can view ALL fields via the adjacent Table tab.
- Visualizations
- Alert Preview: If the alert is process related (and has the
process.entity_idandprocess.parent.entity_idfields - like Sysmon), there will be a process ancestry try available.
- Alert Preview: If the alert is process related (and has the
- Insights
- Entities: Host and user information relating to the alert correlated by Kibana.
- Correlations: All alerts and cases related to this alert.
- Prevalence: How often the values of the highlighted ECS fields have been seen within other alerts.
How to get there:
- Select the alert you want to work with
- Click the
⤢(View details) button to expand the alert details and select the Overview tab
Investigation Guide
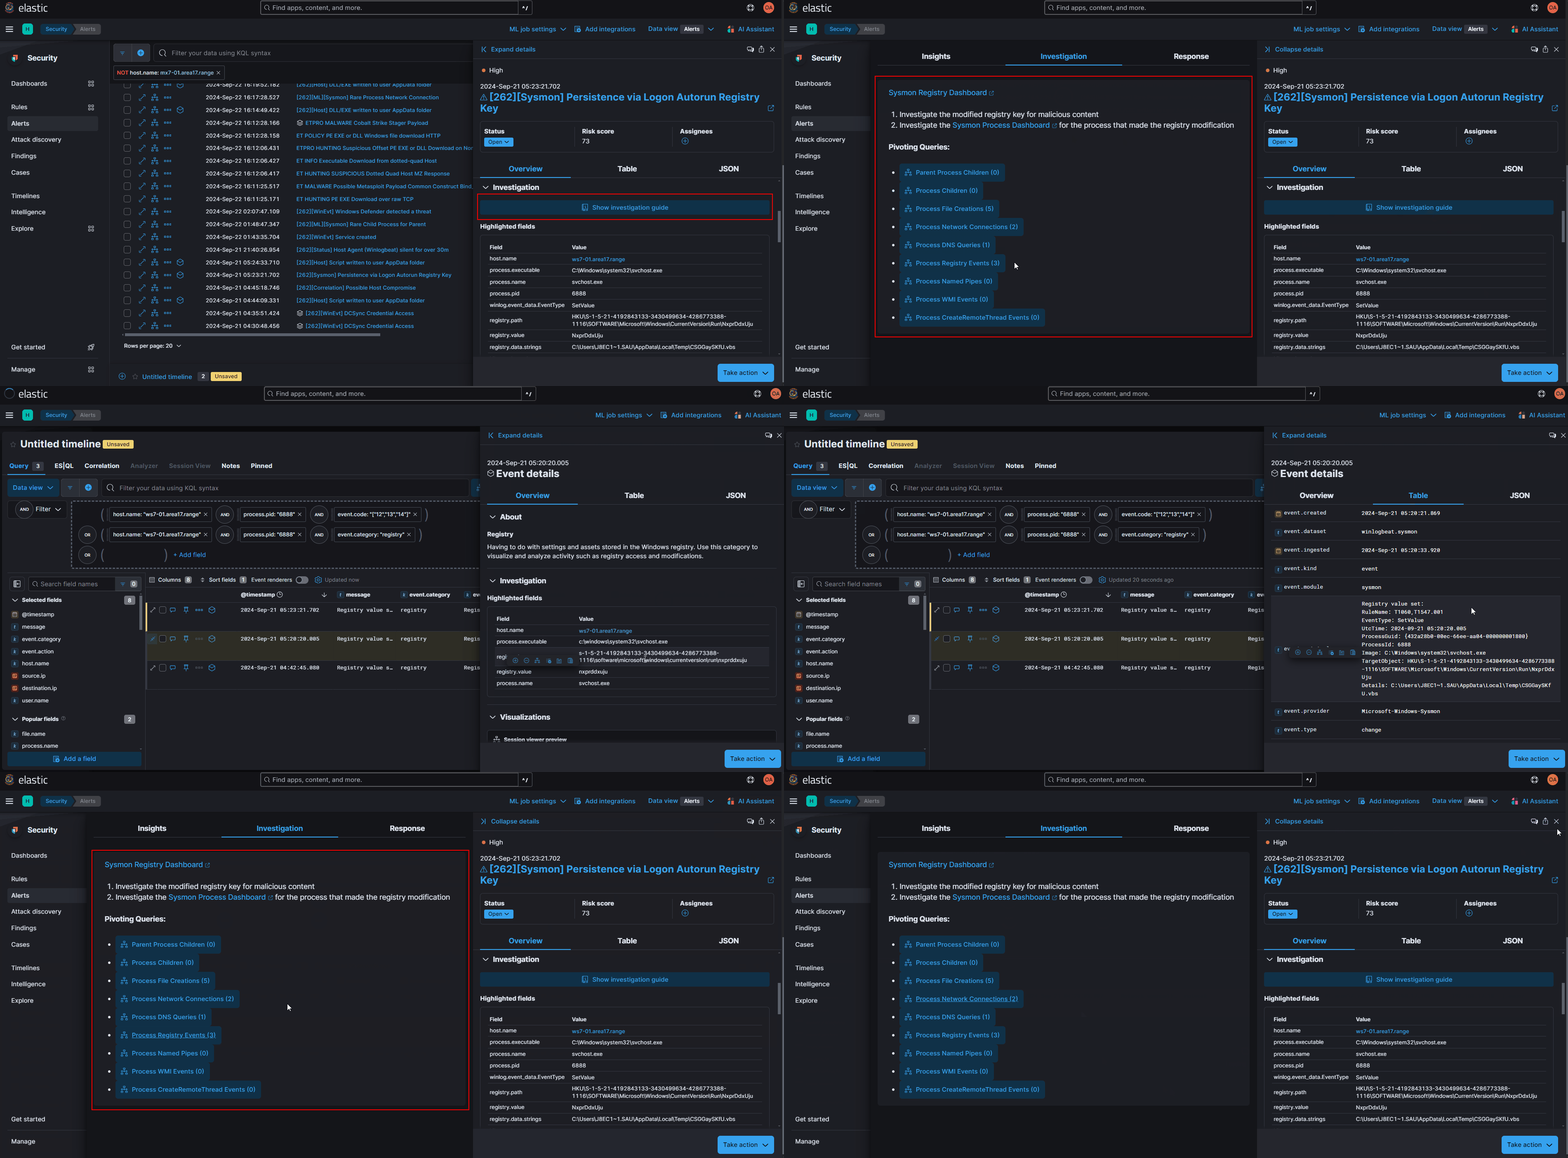
What it is: Investigation Guides are written by the detection rule author and are meant to provide analysts triaging the alert a set of next-steps to follow to help them with their investigation. Be aware that this option will only exist if the author chooses to write an investigation guide - and the quality/helpfulness of the guide may vary.
How to get there:
- Select the alert you want to work with
- Click the
⤢(View details) button to expand the alert details and select the Overview tab - Scroll down to the Investigation section and click the Show investigation guide button
- The investigation guide will pop open to the left of the overview
NOTE: Some investigation guides may have URL links, or even "Investigation" query buttons for you to easily pivot to a "Timeline" search. "Investigation" queries are query templates filled in with fields from the alert. Within 262COS/DOK developed rules, you will normally find a Pivoting Queries section within the Investigation Guide filled with the most likely queries you will likely run to investigate the alert.